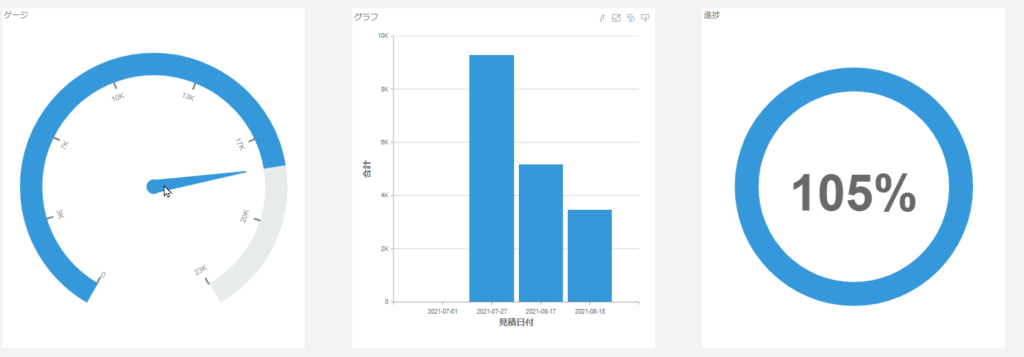
You can easily create a dashboard including graphs and gauges from the record list information registered in kintone. If you find that the graph function of kintone does not work, please consider using it.
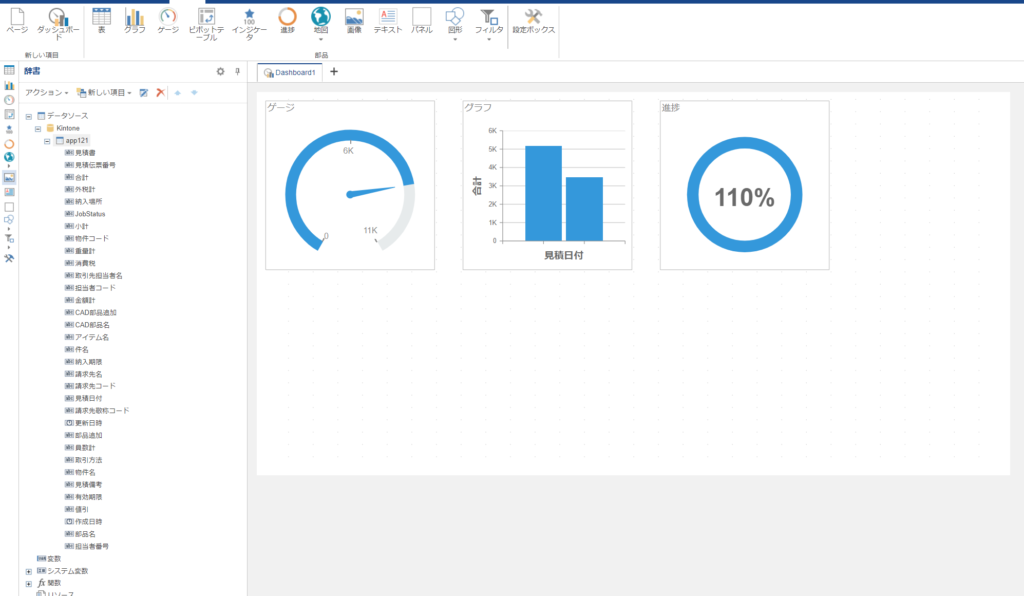
Like kinPrint, you can drag and drop kintone information from the dashboard designer to display the data in any form. You can also use various formulas such as SUM and COUNT. We have various controls such as tables, graphs, gauges, pivot tables, indicators, progress, maps, images, etc.
Dashboard engine for kintone
Those who want more advanced data display than kintone's graph function can try it for free, so please contact us.