
Color Scale Condition This allows you to select components with colors in the rendered report to will correspond to this condition. Color scale conditions work according to the following principles: If the color scale consists of two colors (minimum and maximum), it specifies the minimum and maximum values for the selected data column. Values corresponding to maximum and minimum values are indicated by color. For other values from the selected data column, positions within the color scale are calculated. Colors are assigned to this value, and thus to components, according to their position in the color scale. If the min value is less than or equal to the min value specified in the condition, it becomes the boundary min value, meaning to use the color selected for the min value. If the maximum value of the data column is greater than or equal to the maximum value specified in the condition, it becomes the maximum boundary value. Use the selected color as the maximum value. If the value is between the minimum and maximum values, the background color of the component with this value will be the interpolated color of the minimum and maximum values. If the color scale consists of 3 values (low, medium, high), the minimum, medium, and maximum values are defined. For each value taken from the selected data column, its position in the color scale is calculated and a color is assigned depending on the value's location. So the color of the component will change. A color scale represents a smooth transition between three colors: the smallest to medium color, and the medium to largest color. The background color of components with values exactly in between the minimum and average values is the interpolated color of the minimum and middle values. The background color of a component whose value lies exactly between the mean and maximum values will be the interpolated color of the medium to maximum value. The photo shows the report page.
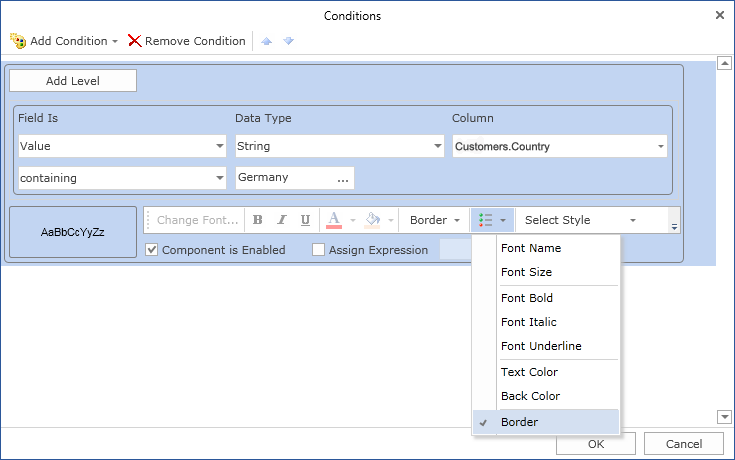
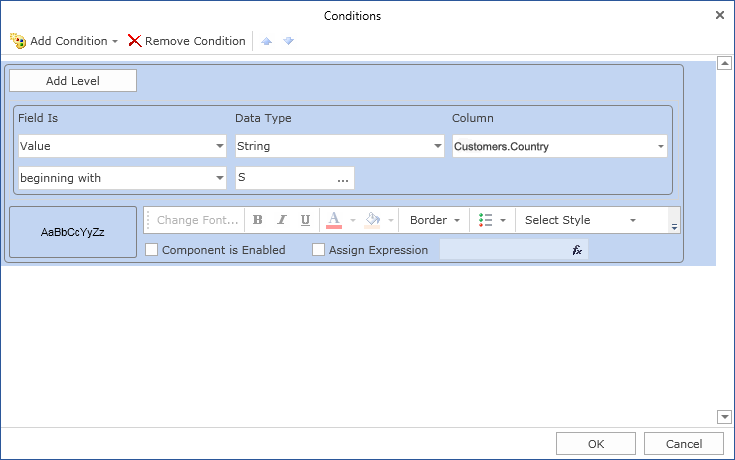
Add a color scale condition. To do this, select a text component, for example the {Employees.EmployeeID} expression component. Add a color scale condition. Change the parameters of the condition. The following image shows the Conditions dialog.
![]() Column field. This field indicates the data column from which the condition value is retrieved.
Column field. This field indicates the data column from which the condition value is retrieved.
![]() [Color scale type field. It gives you the opportunity to choose the type of color scheme (2-color scale or 3-color scale). The following image shows the menu for selecting color scale type a.
[Color scale type field. It gives you the opportunity to choose the type of color scheme (2-color scale or 3-color scale). The following image shows the menu for selecting color scale type a.
![]() [type field. Provides an opportunity to change the type of value specified in the Minimum Color Scale Value field. The following image shows the menu for selecting the value type.
[type field. Provides an opportunity to change the type of value specified in the Minimum Color Scale Value field. The following image shows the menu for selecting the value type.
![]() [value field. Used for minimum color scale.
[value field. Used for minimum color scale.
![]() colour.Used for minimum color scale.
colour.Used for minimum color scale.
![]() sample field. Displays the smallest to medium and medium to largest color scales in the report. If you select Color Scale 2 Color Scale, this field will display a color gradient from min to max.
sample field. Displays the smallest to medium and medium to largest color scales in the report. If you select Color Scale 2 Color Scale, this field will display a color gradient from min to max.
![]() A group of parameters (type, value, color) in the medium color scale..
A group of parameters (type, value, color) in the medium color scale..
![]() Group of parameters (type, value, color) for maximum color scale..
Group of parameters (type, value, color) for maximum color scale..
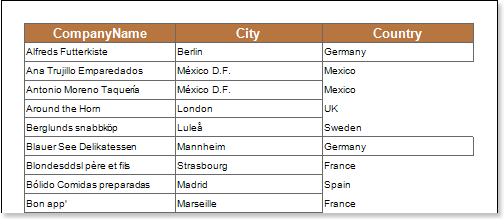
After making changes to the report template, the reporting engine performs conditional formatting of the text components according to the specified parameters. In this case, the background of the text component changes depending on the value of the component. The following image shows a page of a report rendered with conditional formatting.
As you can see in the picture above, the text component changes its background color according to the color scale values.


