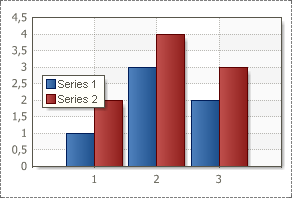
The Value Data Column and Argument Data Column properties are used to specify the data columns from the dictionary to connect the series. The Report Tool renders a series of charts depending on the column values and arguments selected in the Value Data Column and Argument Data Column property fields. For example, if the data column selected from the data source contains 1000 values, all 1000 values will be used to create the chart. Below is an example of a chart with column values from a selected data source.