
Calculating the sum of the report can be done by specifying an expression such as {Sum(DataBand1)}. At the same time, the totals are calculated when the report is rendered. A single value is calculated each time an operation with DataBand is performed. Then all calculated values are summed and the total value is displayed. In this case the sum is associated with the band. Calculating totals for Stimulsoft reports can be done in a different way, i.e. instantly. In other words, it computes totals that are not associated with bands. To do this, use a special prefix Totals with a delimiter '.' in front of the function, e.g. {Totals.Sum(DataBand1)}. Functions prefixed with Totals are calculated where the function is called, not the total associated with the band.
Sum function:
| function | explanation | sample |
| {Avg()}when | Calculate the arithmetic mean. | {Avg(DataSource.Column1)} - Calculates the arithmetic mean of Column1 column. {AvgDate(DataSource.ColumnDate)} - Calculates the average of the dates in the ColumnDate column. {AvgTime(DataSource.ColumnTime)} - Average time by ColumnTime column is calculated. All functions can have two arguments. For example, a report uses several data bands. I need to calculate the arithmetic mean of the first data band. In this case the first argument is the band and the second argument is the object of the calculation - {Avg(DataBand1, DataSource.Column2)}. As a result, it calculates the arithmetic mean of Column2, but only the DataBand1 value. |
| {Count()} | Calculate the number of values or the number of unique values. | {Count()} - the result is the number of entries in the data source. {Count(DataBand1, DataSource.Column1)} - The result is the number of entries in Column1 column of DataBand1. {CountDistinct(DataSource.Column1)} - The result is the number of unique entries in DataSource.Column1. {CountDistinct(DataBand2, DataSource.Column2)} - The result is the number of unique entries in Column2 column of DataBand2. |
| {First()} | Display the first value of the specified object. | {First(DataSource1.Column1)} - The result is the first value of Column1 from DataSource1. {First(DataBand2, DataSource.Column2)} - The result is the first value of Column2 in the DataBand2 band. |
| {Last()} | Display the last value of the specified object. | {Last(DataSource1.Column1)} - The result is the last value of Column1 from DataSource1. {Last(DataBand2, DataSource.Column2)} - The result is the last value of Column2 in DataBand2. |
| {Max()} | Shows the maximum value of the specified object. | {Max(DataSource1.Column1)} - The result is the maximum value from Column1 of DataSource1. {MaxDate(DataSource1.ColumnDate)} - The result is the maximum date from ColumnDate of DataSource1. {MaxTime(DataSource1.ColumnTime)} - The result is the maximum time from ColumnTime of DataSource1. {MaxStr(DataSource1.Column1)} - All values are sorted alphabetically. The result is the final value. {Max(DataBand2, DataSource.Column2)} - The result will be the maximum value of Column2 in the DataBand2 band. |
| {Median()} | Displays the average (non-arithmetic) value from the list. | Suppose Column1 contains 5 values: 2, 5, 6, 1, 7. The {Median(DataSource1.Column1)} function displays the average value of this list. So the result is 6. {Median(DataBand2, DataSource.Column2)} - The result is the mean value of Column2 in DataBand2. |
| {Min()} | Shows the maximum value of the specified object. | {Min(DataSource1.Column1)} - The result is the minimum value from Column1 of DataSource1. {MinDate(DataSource1.ColumnDate)} - The result is the minimum date from DataSource1's ColumnDate. {MinTime(DataSource1.ColumnTime)} - The result is the minimum time from ColumnTime of DataSource1. {MinStr(DataSource1.Column1)} - All values are sorted alphabetically. The result is the first value. {Min(DataBand2, DataSource.Column2)} - The result is the minimum value of Column2 in the DataBand2 band. |
| {Mode()} | Display the most common values in a list of values. | {Mode(DataSource1.Column1)}. Suppose Column1 contains a list of values: 2, 2, 6, 7, 7, 8, 7, 6, 5, 9, 4. In this case the result is 7. This is because it will be repeated most frequently in the following list. value. {Mode(DataBand2, DataSource.Column2)} - The result will be the value from Column2 of DataBand2 which is most common. |
| {Rank(,)} | Display the rank of the value. The prefix Totals is required: | {Totals.Rank(DataBand1, DataSource.Column1)}. Suppose Column1 contains a list of values: 44, 9, 36, 55, 71. In this case, the values are sorted in ascending order, i.e. 9, 36, 44, 55, 71, and each is given a rank. assigned. Number 9 receives rank 1. 36 - rank 2; 44 - rank 3; 55 - rank 4; 71 - rank 5. By default, it calculates tight ranks and sorts the values for assigning ranks in ascending order. {Totals.Rank(DataBand1, DataSource.Column1, true, StiRankOrder.Dess)} - in this case, it is set to true, hence the lower rank. When ranks are assigned, the values are sorted in descending order because StiRankOrder is set to Desc. To sort in ascending order (used by default), it should be set to Asc (StiRankOrder.Asc). An example of loose rank is {Totals.Rank(DataBand1, DataSource.Column1, false, StiRankOrder.Asc)}. Assume Column1 contains a list of values: 44, 9, 44, 9, 31, 64, 68, 71. Values are assigned in ascending order. That is, 9, 9, 31, 44, 44, 44, 68, 71. In this case the rank would be: 9 - rank 1, 9 - rank 1, 31 - rank 3, 44 - rank 4, 44 - rank 4, 44 - rank 4, 68 - rank 7, 71 - rank 8. That is, when assigning a rank to a number, the rank of the previous value and the number of values with this rank are taken into account. |
| {Sum()} | Display the result of the sum of the values. | {Sum(DataSource1.Column1)} - The result is the sum of all Column1 values in DataSource1. {SumDistinct(DataSource1.Column1)} - The result is the sum of all unique Column1 values in DataSource1. SumTime(DataSource1.Column1) - The result is the sum of times from Column1 of DataSource1. {Sum(DataBand2, DataSource2.Column2)} - The result is the sum of the values in Column2 of DataBand2. {SumDistinct(DataBand1, DataSource.Column1, DataSource.Column2)} - The result is the sum of Column2 values corresponding to the unique values from Column1 in DataBand2. |
A sample for calculating sums not associated with bands.
For example, I have a master detail report that is a list of products by category. 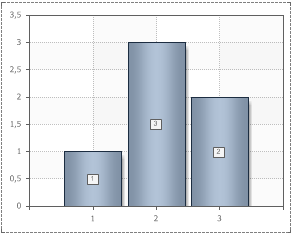 This report can calculate results for each category across the report. It is also possible to calculate the percentage of each category in the total. First, let's calculate the amount of products in the category. To do this, add a footer band to your report template and put a text component with a formula to calculate the sum {Sum(DataBand2, Products.UnitPrice)}. Sum of values uses the Sum function, whose argument specifies the object for which the sum and data columns are calculated, whose values are summarized. Since we need to calculate the quantity of products for each category, we want to calculate the sum over the detailed data band, namely DataBand2. The values in the UnitPrice column indicate the price of each product. therefore,  In this case the result is associated with the data band. Use functions not associated with bands to calculate totals in reports. For this we add the prefix Totals to the function with a '.' separator. As an object, you must specify the data source. The formula to calculate the total for the report would be {Totals.Sum(Products, Products.UnitPrice)}. The result will be displayed on the master band.  Each time you print a masterband on a report, you will see totals for each report. You can use the results of the calculation to calculate the share of each category in the grand total. Results are displayed as percentages. To calculate the ratio, you have to divide the total by the category and divide the total by the report - {(Sum(DataBand2, Products.UnitsInStock)/Totals.Sum(Products, Products.UnitsInStock))}. Set the percentage format for the text component where the share is displayed. The result will be displayed on the master band.  Therefore, you can calculate any total in your report. To calculate totals that are not related to bands, prefix the function name with Totals and use “.” as the separator. |


