When creating a report, you may need to print only the values that meet certain criteria, rather than all the values from the data source. Use data filtering to select the required settings. Filtering is set using the Filters property of the Series Editor. Specify the conditions for each filter. If the condition is true, the result of the calculation is true. This means that this value will be used when rendering the chart. If the result of the filter condition calculation is false, this value will be ignored. Each filter represents a condition for processing data values. The following figure shows an example of a filter panel.
![]() How to select a condition depending on which filtering (value or argument) is performed.
How to select a condition depending on which filtering (value or argument) is performed.
![]() This field specifies the type of data that indicates which condition works. You can use five types of data: strings, numbers, dates and times, Booleans, and expressions. The data type affects how the report generator handles the condition. For example, if the data type is a string, the method of processing the string is used. In addition, the list of available conditional operations changes depending on the type of data. For example, you can use the Container operation only for the String data type. The expression data type is used to set a second value instead of an expression.
This field specifies the type of data that indicates which condition works. You can use five types of data: strings, numbers, dates and times, Booleans, and expressions. The data type affects how the report generator handles the condition. For example, if the data type is a string, the method of processing the string is used. In addition, the list of available conditional operations changes depending on the type of data. For example, you can use the Container operation only for the String data type. The expression data type is used to set a second value instead of an expression.
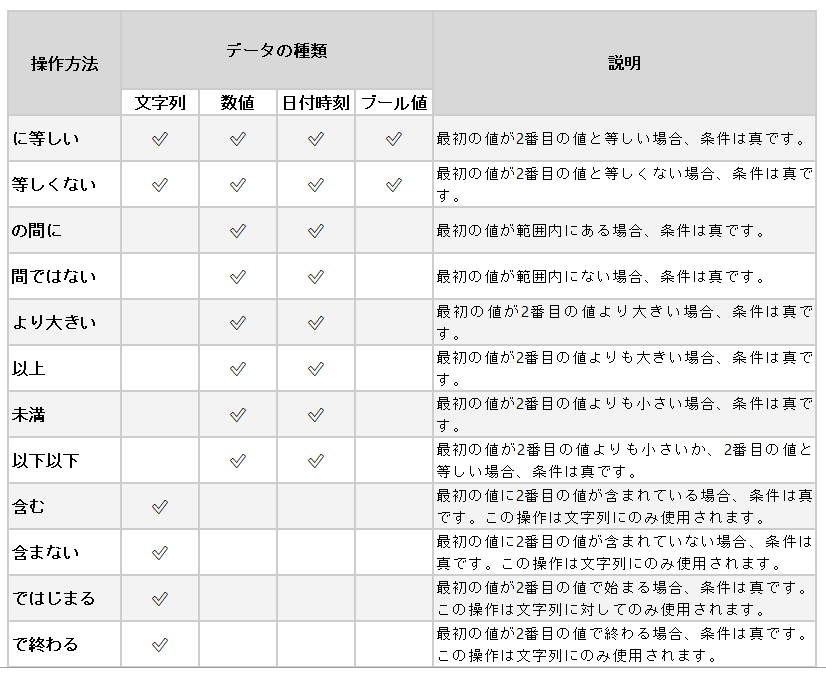
![]() The type of operation that can calculate the value of the condition. All available types of operations are available in the table below.
The type of operation that can calculate the value of the condition. All available types of operations are available in the table below.
![]() The value of the filter condition.
The value of the filter condition.
The list of available operations depends on the type of data. Below is a table of the operations and descriptions of each type of data.