
Range property is used to display a specified portion of the chart. That is, the portion of the chart that falls within the specified range of values is displayed. The image below shows a chart from 2 to 4 with the Range property set on the X axis.
A range consists of values for three fields:
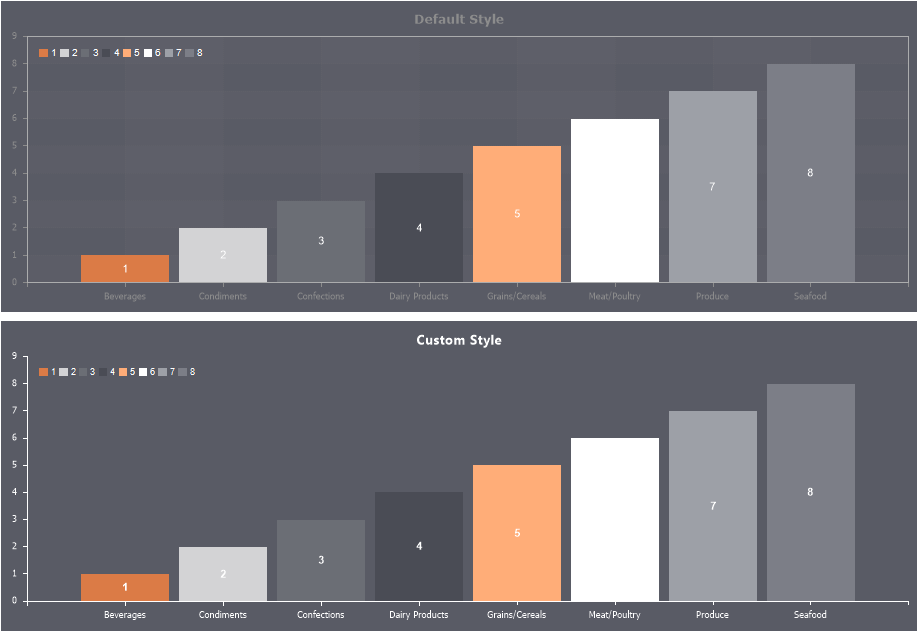
![]() Automatic. If the Auto field is set to true, the chart will be fully displayed and the value range will be calculated automatically. The following figure shows an example.
Automatic. If the Auto field is set to true, the chart will be fully displayed and the value range will be calculated automatically. The following figure shows an example.
If the auto field is set to false, all values in the range specified in the min and max fields are considered. If the Auto field is set to False and the Min and Max field values are set to 0, the chart will be fully displayed.
![]() minimum- set the start of the range.
minimum- set the start of the range.
![]() maximum- set the end of the range.
maximum- set the end of the range.
maximumvalueminimumIf less than the value, the chart will be fully displayed.


