
In this article, let's review the steps to render the bands of the report and define the relationships at the first level of nesting. At the first level of nesting, the report has no hierarchy, only simple lists, only simple groups, and so on. All bands can be categorized into the following types:
![]() Page bands are page headers, page footers and overlays. These bands are related to the report page and appear on each page of the report.
Page bands are page headers, page footers and overlays. These bands are related to the report page and appear on each page of the report.![]() The report bands are Report Title and Report Summary. As the group name suggests, these bands are interconnected with the report and are used to display the report title and summary. They are displayed only once.
The report bands are Report Title and Report Summary. As the group name suggests, these bands are interconnected with the report and are used to display the report title and summary. They are displayed only once.![]() Wristbands are data bands, hierarchical bands. In the text below, we will refer to data bands, but also mean that they can be used instead of hierarchical bands.
Wristbands are data bands, hierarchical bands. In the text below, we will refer to data bands, but also mean that they can be used instead of hierarchical bands.![]() The bands associated with the data band are header band, footer band, group header band, group footer band, column header band, column footer band, empty band.
The bands associated with the data band are header band, footer band, group header band, group footer band, column header band, column footer band, empty band.![]() The Child Band
The Child Band
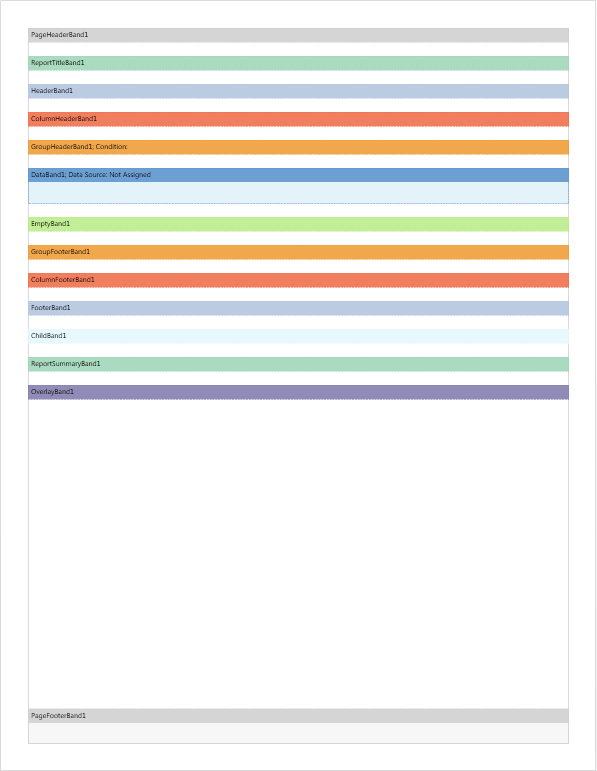
Order of bands in report template
All bands are displayed in strict order. This is because each band has a specific function in the report. And the order in which you print the bands is very important.
| order | band name | explanation |
| 1 | page header | each page. Printing the first page is optional. |
| 2 | report title | once at the beginning of the report. The report title band can be printed before the page header band if the page on which both bands are placed has the TitleBefore Header property set to true. |
| 3 | header,column header | Once before data output (for column headers - once per column. New per-page output is optional. |
| 4 | group header | at the beginning of each group. Output to each new page is optional. |
| 5 | data | Once per row of data. |
| 6 | empty band | For each empty line on every page of the report. |
| 7 | Group footer | at the end of each group. |
| 8 | footer,column footer | After all data is output (for column footers - once per column). Output to each new page is optional. |
| 9 | Report overview | Once at the end of the report. |
| 10 | Overlay | Once for every page of the report. |
| 11 | page footer | all pages. Printing the first page is optional. |
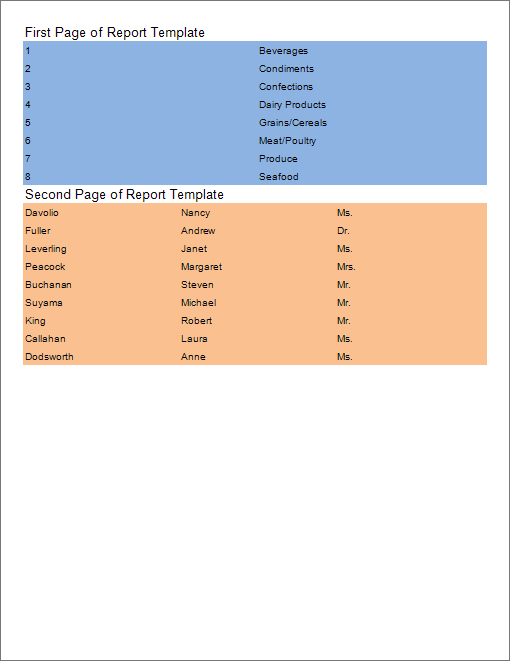
Child bands can be placed in any band except 'Page Header', 'Report Summary' and 'Page Footer'. The image below is a report page template showing band positions.
Rendering order
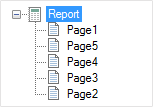
When rendering a report, the pages of the report template are processed in order. The order in which pages are processed is determined by their position in the report tree. The higher the page position in the report tree, the higher the priority (order) for processing.
For the report tree shown above, the page processing order is Page1 first, then Page5, Page4, Page3, and finally Page2. Suppose all the bands were placed on Page1 (see example report template page showing band positions above). In this case the bands are processed in several steps.
![]() In the first stage, we do a preliminary analysis of all the bands and determine the positions of the next page bands Page Header Band 1, Page Footer Band 1 and Overlay Band 1. These bands are always processed primarily during report rendering and are added to each new page. Also, the report title band 1 is added to the first page of the rendered report.
In the first stage, we do a preliminary analysis of all the bands and determine the positions of the next page bands Page Header Band 1, Page Footer Band 1 and Overlay Band 1. These bands are always processed primarily during report rendering and are added to each new page. Also, the report title band 1 is added to the first page of the rendered report.
![]() The second step is to analyze the other bands.
The second step is to analyze the other bands.
After analysis, the report will start to render. Report Summary 1 is processed last.
band relationship
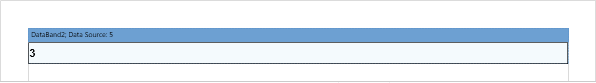
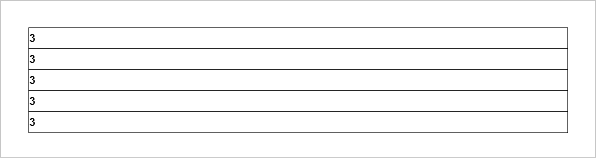
As above, all bands in report rendering (except PageHeaderBand1, PageFooterBand1, OverlayBand1, ReportTitleBand1, ReportSummaryBand1) depend on DataBand1. Let's consider these relationships in more detail and start with a simple example. data band,Placed on the template page.

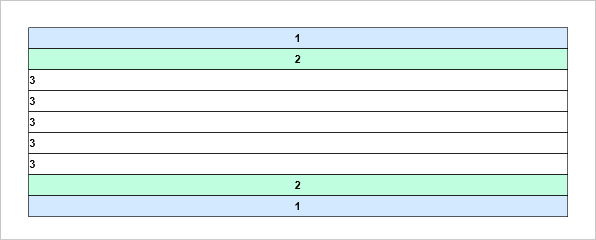
The number of records in the data source is 5, which means the data band will be printed 5 times.
Almost all bands can be divided into two categories: headers and footers. Each header corresponds to a footer of the same type.
The order of the bands on the page (top to bottom).
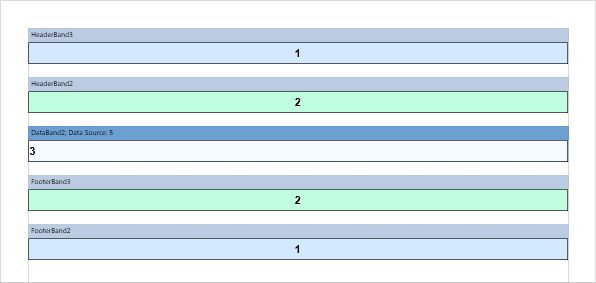
| order | band name |
| 1 | HeaderBand3 |
| 2 | HeaderBand2 |
| 3 | DataBand2 |
| 4 | Footer Band 3 |
| 5 | Footer Band 2 |
in this case,HeaderBand3 iscorresponds toFooter Band 2 ,as well asHeaderBand2 isEquivalent to FooterBand3. In other words, the first header of the data band corresponds to the footer of the first data band. Here is an example of the rendered report:

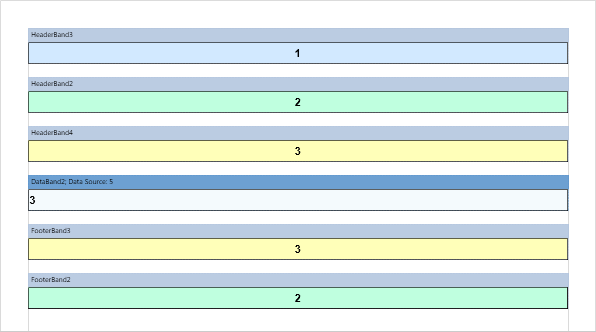
There are often different numbers of headers and footers for a particular type. For example, if you modify the example above and add HeaderBand4 between HeaderBand2 and DataBand2, HeaderBand4 corresponds to FooterBand3 (yellow in color), HeaderBand2 corresponds to FooterBand2 (turquoise in color), but HeaderBand3 (blue in color) Bands do not have footers.
In the example above, let's equalize the number of headers and footers in the data.

In this case, HeaderBand4 corresponds to FooterBand3 (yellow), HeaderBand2-FooterBand4 (turquoise), HeaderBand3 (blue)-FooterBand2 (zero height). At the same time FooterBand4 is not printed (visible) in the rendered report.

Therefore, the report will display headers and footers evenly, making it easy to determine their correspondence. At the same time, you can turn off (not display) specific bands. All of the above examples were considered Header Bands and Footer Bands. The same principle applies to the group header band, group footer band, column header band, and column footer band.
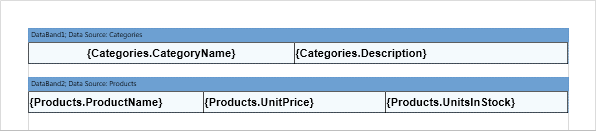
Below is an example where the report has several data bands.

These bands are not related to each other. So they are processed in order. First, DataBand1 (category list) is processed, then DataBand2 (product list).

Then add a header band to your report template. A data band that refers to a header band, above which it is placed. In order for HeaderBand1 to correspond to DataBand1 (list of categories), it must be placed above this databand.
In order for HeaderBand2 to be related to DataBand2 (product list), it must be placed directly above this Data Band.
And the first page of the report looks like this:
Next, think about the relationship between footers and multiple data bands. As shown above, the footer in the report template only points below this data band and is placed directly below it. At the same time, the footer band also concludes the header band. For example, say you want to display the total value by the number of categories. In this case, FooterBand1 should be placed below the data band, which displays the list of categories, and above HeaderBand2, which displays the list of products.
The report page looks like this:
In order to display totals in a databand with a list of products, FooterBand2 must be placed below DataBand2. In this example, let's use the Sum function to calculate the total price of all products. This result will be displayed on each page of the report (set the Print on All Pages property to true). Below is a page template showing a list of products with a footer near the data band.
And the first page of the report looks like this:
 In this case FooterBand1 and HeaderBand2 do not refer to any data bands. When rendering a report, first all data bands are defined. Then, for each databand, the headers associated with this databand are defined. All of these headers sit above one footer band or another data band. Then the footer related to this data band is defined. These footers are placed below the next header or another data band. So in the rendered report DataBand1 has no footer, DataBand2 has no header and HeaderBand2 and FooterBand1 are not displayed as they do not belong to any databand. 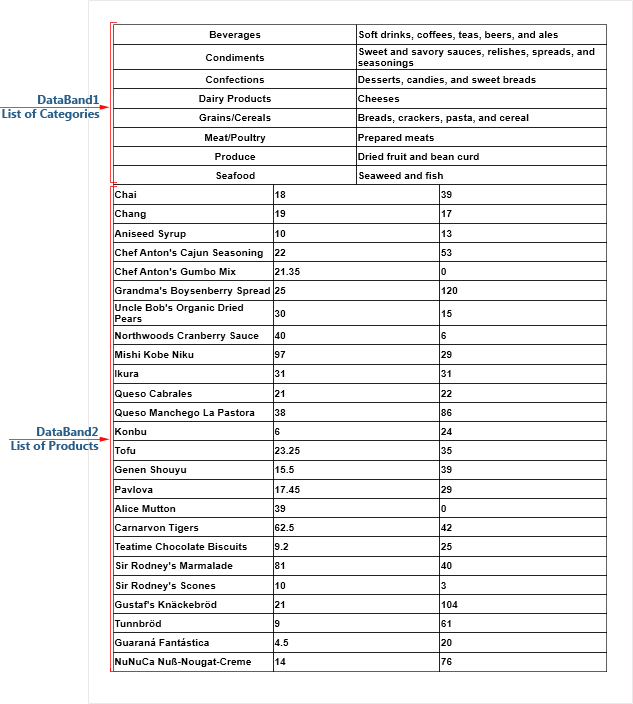 |
The same principle of correspondence applies to the group header band, group footer band, column header band and column footer band.
![]() The header is placed above the associated data band and the footer below. Headers and footers cannot be printed by themselves, as they must reference specific data bands.
The header is placed above the associated data band and the footer below. Headers and footers cannot be printed by themselves, as they must reference specific data bands.
![]() Always check the number of headers and footers, especially in reports with groups. It may be easier to add specific bands (headers or footers) so that their number is equal and the lines are clearly traced. - Set band height to zero in the report template if you want to hide the band in the rendered report.
Always check the number of headers and footers, especially in reports with groups. It may be easier to add specific bands (headers or footers) so that their number is equal and the lines are clearly traced. - Set band height to zero in the report template if you want to hide the band in the rendered report.


