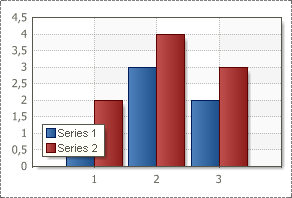
To connect a set of data using an expression, you should use the Value and Argument properties. The values of these properties are expressions, the result of which is used to obtain a single value of data and an argument of data. When using the Value and Argument properties, the expressions specified in the fields of these properties return only one value when calculated, rather than a list of data, so in this chart the data source (Data Source property) is You have to choose. Also, the Value property returns a value in Number format, but the Argument property does not care about the data type. In order for the report generator to know which list to use for the report, you need to specify the data source. Given a data source, the report generator runs through all the records in the data source and calculates all values and arguments according to the expressions given in the value and argument property fields. Charts can be created based on the calculation results. You can also specify sorting and filtering for data source data. The figure below is an example of a rendered chart based on the values of the selected columns in the data source and the calculated arguments.