AcrossThenDown mode has the disadvantage that the information on the page is hard to read because the content is output from left to right and then down. On the other hand, outputting columns in DownThenAcross mode is often easier to read. In this mode, the first column will display data, and when it is full, the second column will display data, and so on.
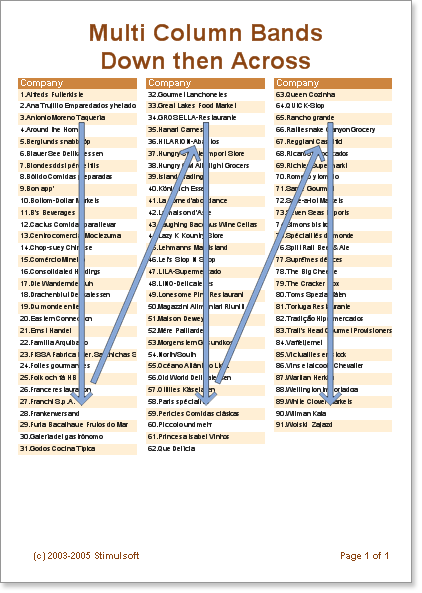
When using DownThenAcross mode, the report generator attempts to evenly distribute data rows across columns. When all data rows are distributed into columns, the first column is printed. Unlike AcrossThenDown mode, the data takes up as much space as it needs on the page and is presented in an easy-to-read format.
![]() caution:The number of data band columns is unlimited.
caution:The number of data band columns is unlimited.
example
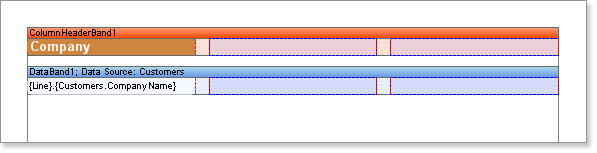
This example creates a report with columns in DownThenAcross mode. Place two bands on one page. ColumnHeader band and Data band. Set the Column property to 3 in the data band (this will create 3 columns). Set the column width with the ColumnWidth property and the space between columns with the ColumnGaps property. Set the data band's ColumnDirection property to DownThenAcross mode.
In the ColumnHeader band, place a Text component representing the Column's title.
![]() caution: The ends of the columns are indicated by red vertical lines. All components placed in the first column are automatically repeated in the other columns.
caution: The ends of the columns are indicated by red vertical lines. All components placed in the first column are automatically repeated in the other columns.
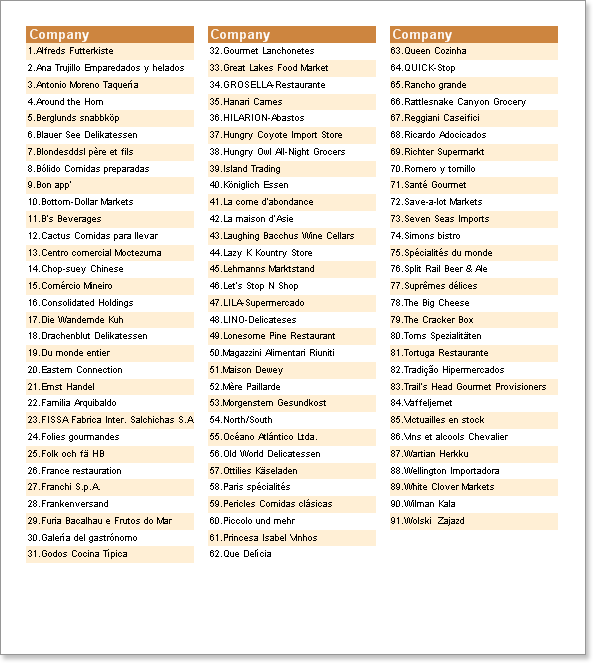
Now let's run the report. The report generator tried to evenly distribute all data rows across the three columns. Using your sample data, there are 31 rows in the 1st column, 31 rows in the 2nd column, and 29 rows in the 3rd column. All information can be read from top to bottom and left to right.