
The Format property is used to format the contents of the series label. This property has multiple values.
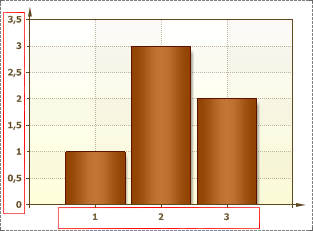
![]() numbers. The N value of the Format property is used for general representation of numbers. When filling out the Format, you can specify the number of decimal places to use after the N value. If no number is specified after N, it will only be displayed if there are digits after the decimal point in the result of the calculation. Below is a chart with the "Series Label" "Format" property set to "N".
numbers. The N value of the Format property is used for general representation of numbers. When filling out the Format, you can specify the number of decimal places to use after the N value. If no number is specified after N, it will only be displayed if there are digits after the decimal point in the result of the calculation. Below is a chart with the "Series Label" "Format" property set to "N".
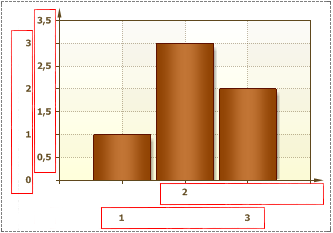
![]() currency. The Format property's C value is used to display the currency symbol in the series label. After the C value, you can specify the number of decimal places to use. Below is a chart with the Format property of the "Series Labels" set to C.
currency. The Format property's C value is used to display the currency symbol in the series label. After the C value, you can specify the number of decimal places to use. Below is a chart with the Format property of the "Series Labels" set to C.
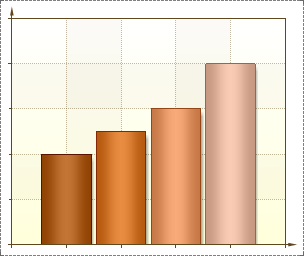
![]() percentage. The P-value in the Format property is used to display percent symbols in series labels. After the p-value you can specify the number of decimal places to use. Below is a chart with the "Series Label" Format property set to P.
percentage. The P-value in the Format property is used to display percent symbols in series labels. After the p-value you can specify the number of decimal places to use. Below is a chart with the "Series Label" Format property set to P.
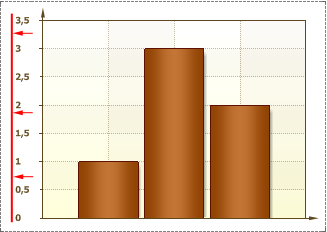
![]() date. The MM/dd/yyyy, MMMM dd, yyyy MMMM value of the Format property converts the argument value to a date. MM/dd/yyyy – displays the date as “01.20.2010”. MMMM dd – displays dates like “September 29th” and yyyy MMMM – displays dates like “March 2010”. The image below shows the chart's Format property set to MM/dd/yyyy.
date. The MM/dd/yyyy, MMMM dd, yyyy MMMM value of the Format property converts the argument value to a date. MM/dd/yyyy – displays the date as “01.20.2010”. MMMM dd – displays dates like “September 29th” and yyyy MMMM – displays dates like “March 2010”. The image below shows the chart's Format property set to MM/dd/yyyy.
To reset the formatting properties of the selected cells and restore the default formatting, select an empty field and clear the formatting.


