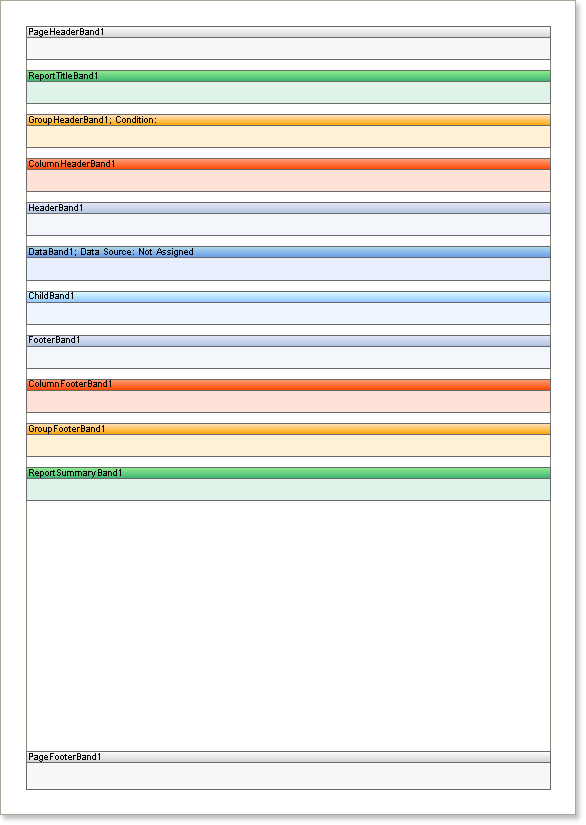
Standard bands are the basic elements of reports. The following table shows all standard bands.
| icon | band name | explanation |
| report title | This band is printed at the beginning of the report | |
| Report overview | This band is printed at the end of the report | |
| page header | This band is printed at the top of each page | |
| page footer | This band is printed at the bottom of each page | |
| group header | This band will be printed at the beginning of the group | |
| Group footer | This band will be printed at the end of the group | |
| header | This band is printed before the data | |
| footer | This band will be printed after the data | |
| column header | This band is printed before the columns are printed | |
| column footer | This band is printed after the columns are printed | |
| data | This band will be printed as many as the number of rows in the data source | |
| hierarchical data | This band will be printed for the number of rows in the data source. Data items are output as a tree | |
| Child | This band will print only once after the band placed below it | |
| Empty Data | Fill empty space at the bottom of the page | |
| Overlay | This band will be printed on the background of the page. No other bands are affected. |
Each type of band has its own color to help you understand the report structure and make the report template look more clear.