
The Visible property is used to display the X and Y axes. Below is a chart with the Visibility property set to true (axis visible).
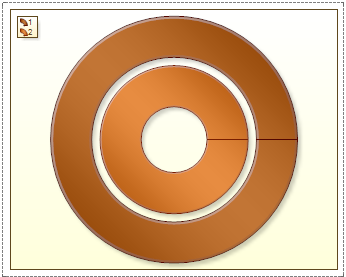
If you set the Visible property to false, the X and Y axes will not be visible. It should look like the picture below.
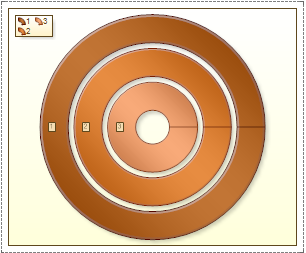
The Visible property has an X-axis and a Y-axis. It is possible to hide/show the axes separately. Also, this property is used to display the top X-axis and the right Y-axis. By default, for axes this property is set to false. The figure below is an example of a chart with the top X-axis and right Y-axis displayed.
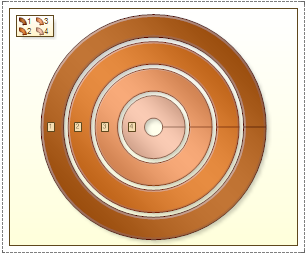
The Visible property has a top x-axis and a right y-axis. For example, combinations of the upper X-axis and the left Y-axis, the X-axis and the right Y-axis, etc. are also possible.
By default the Visible property is set to true.


